Telemetry
About
Telemetry data such as logs, metrics, and traces will help developers understand the internal state of the system. This page walks though different types of telemetry and observability available in Toolbox.
Toolbox exports telemetry data of logs via standard out/err, and traces/metrics through OpenTelemetry. Additional flags can be passed to Toolbox to enable different logging behavior, or to export metrics through a specific exporter.
Logging
The following flags can be used to customize Toolbox logging:
| Flag | Description |
|---|---|
--log-level | Preferred log level, allowed values: debug, info, warn, error. Default: info. |
--logging-format | Preferred logging format, allowed values: standard, json. Default: standard. |
Example:
./toolbox --tools-file "tools.yaml" --log-level warn --logging-format json
Level
Toolbox supports the following log levels, including:
| Log level | Description |
|---|---|
| Debug | Debug logs typically contain information that is only useful during the debugging phase and may be of little value during production. |
| Info | Info logs include information about successful operations within the application, such as a successful start, pause, or exit of the application. |
| Warn | Warning logs are slightly less severe than error conditions. While it does not cause an error, it indicates that an operation might fail in the future if action is not taken now. |
| Error | Error log is assigned to event logs that contain an application error message. |
Toolbox will only output logs that are equal or more severe to the level that it is set. Below are the log levels that Toolbox supports in the order of severity.
Format
Toolbox supports both standard and structured logging format.
The standard logging outputs log as string:
2024-11-12T15:08:11.451377-08:00 INFO "Initialized 0 sources.\n"
The structured logging outputs log as JSON:
{
  "timestamp":"2024-11-04T16:45:11.987299-08:00",
  "severity":"ERROR",
  "logging.googleapis.com/sourceLocation":{...},
  "message":"unable to parse tool file at \"tools.yaml\": \"cloud-sql-postgres1\" is not a valid type of data source"
}
Tip
logging.googleapis.com/sourceLocation shows the source code
location information associated with the log entry, if any.
Telemetry
Toolbox supports exporting metrics and traces to any OpenTelemetry compatible exporter.
Metrics
A metric is a measurement of a service captured at runtime. The collected data can be used to provide important insights into the service. Toolbox metrics follow the MCP Semantic Conventions where applicable, and include additional Toolbox-specific metrics for deeper observability.
Standard Metrics
| Metric Name | Type | Unit | Description |
|---|---|---|---|
mcp.server.operation.duration | Histogram | s | Duration of a single MCP JSON-RPC operation. |
mcp.server.session.duration | Histogram | s | Duration of an MCP session. |
Toolbox-specific Metrics
| Metric Name | Type | Unit | Description |
|---|---|---|---|
toolbox.server.mcp.active_sessions | UpDownCounter | {session} | Current count of active MCP sessions. |
toolbox.tool.execution.duration | Histogram | s | Duration of backend tool execution. |
Duration histograms use the following bucket boundaries (in seconds), as defined by the MCP semantic conventions:
0.01, 0.02, 0.05, 0.1, 0.2, 0.5, 1, 2, 5, 10, 30, 60, 120, 300
Metric Attributes
The attributes recorded with each metric are listed below. Attributes marked optional are only included when applicable.
mcp.server.operation.duration
| Attribute | Description | Optional |
|---|---|---|
mcp.method.name | MCP JSON-RPC method name (e.g. tools/call). | |
network.transport | Network transport (tcp for HTTP/SSE, pipe for stdio). | |
network.protocol.name | Network protocol name (http or stdio). | |
toolset.name | Name of the toolset being served. | |
mcp.protocol.version | Negotiated MCP protocol version (e.g. 2024-11-05). | Yes |
network.protocol.version | HTTP protocol version (e.g. 1.1). | Yes |
gen_ai.operation.name | GenAI operation name (e.g. execute_tool). | Yes |
gen_ai.tool.name | Name of the tool invoked (set for tools/call requests). | Yes |
gen_ai.prompt.name | Name of the prompt retrieved (set for prompts/get requests). | Yes |
error.type | Description of the error if the operation failed. | Yes |
mcp.server.session.duration and toolbox.server.mcp.active_sessions
| Attribute | Description | Optional |
|---|---|---|
network.transport | Network transport (tcp for HTTP/SSE, pipe for stdio). | |
network.protocol.name | Network protocol name (http or stdio). | |
mcp.protocol.version | Negotiated MCP protocol version (e.g. 2024-11-05). | Yes |
network.protocol.version | HTTP protocol version (e.g. 1.1). | Yes |
toolset.name | Name of the toolset (HTTP/SSE sessions only). | Yes |
error.type | Description of the error if the session ended with a failure. | Yes |
toolbox.tool.execution.duration
| Attribute | Description | Optional |
|---|---|---|
gen_ai.tool.name | Name of the tool invoked. | |
network.protocol.name | Network protocol name. | Yes |
network.protocol.version | Network protocol version. | Yes |
error.type | Description of the error if invocation failed. | Yes |
Traces
A trace is a tree of spans that shows the path that a request makes through an application.
Initialization Spans
When Toolbox starts, it generates a root span toolbox/server/init with child
spans for each component initialized:
toolbox/server/init
├── toolbox/server/source/init         attr: source_type, source_name
│   └── toolbox/server/source/connect  attr: source_type, source_name
├── toolbox/server/auth/init           attr: auth_type, auth_name
├── toolbox/server/embeddingmodel/init attr: model_type, model_name
├── toolbox/server/tool/init           attr: tool_type, tool_name
├── toolbox/server/toolset/init        attr: toolset.name
└── toolbox/server/prompt/init         attr: prompt_type, prompt_name
| Span Name | Description | Attributes |
|---|---|---|
toolbox/server/init | Root span for server initialization. | |
toolbox/server/source/init | Initialization of a data source. | source_type, source_name |
toolbox/server/source/connect | Database connection pool initialization. | source_type, source_name |
toolbox/server/auth/init | Initialization of an auth service. | auth_type, auth_name |
toolbox/server/embeddingmodel/init | Initialization of an embedding model. | model_type, model_name |
toolbox/server/tool/init | Initialization of a tool. | tool_type, tool_name |
toolbox/server/toolset/init | Initialization of a toolset. | toolset.name |
toolbox/server/prompt/init | Initialization of a prompt. | prompt_type, prompt_name |
Request Spans
Each incoming MCP request generates a transport span, with a child span for the MCP method being processed.
Toolbox connection spans
| Span Name | Description | Key Attributes |
|---|---|---|
toolbox/server/mcp/sse | SSE session transport span (protocol 2024-11-05). | mcp.session.id, toolset.name |
toolbox/server/mcp/http | HTTP transport span (streamable HTTP). | toolset.name |
toolbox/server/mcp/stdio | stdio transport span. |
MCP method spans
Method-level spans follow the MCP Semantic Conventions. Each span represents the processing of a single MCP request or notification.
The span name follows the format {mcp.method.name} {target} where target is
{gen_ai.tool.name} or {gen_ai.prompt.name} when applicable, otherwise just
{mcp.method.name}. Span status is set to ERROR when an error occurs,
with the status description set to the JSON-RPC error message.
All method spans include the following attributes:
| Attribute | Description | Optional |
|---|---|---|
mcp.method.name | MCP JSON-RPC method name. | |
network.transport | Network transport used for the request. | |
network.protocol.name | Network protocol name. | |
toolset.name | Name of the toolset. | |
mcp.protocol.version | Negotiated MCP protocol version. | Yes |
network.protocol.version | HTTP protocol version. | Yes |
jsonrpc.request.id | JSON-RPC request ID. | Yes |
jsonrpc.error.code | JSON-RPC error code, set when an error occurs. | Yes |
error.type | Description of the error if the operation failed. | Yes |
Context Propagation
Toolbox supports distributed tracing via the W3C Trace Context standard. Incoming trace context is extracted in two ways:
- HTTP headers: The
traceparentandtracestateheaders are read from incoming HTTP requests. - JSON-RPC
_metafield: Theparams._meta.traceparentandparams._meta.tracestatefields are read from the JSON-RPC message body. This allows trace context to propagate over stdio transport.
The examples below show how spans are connected across the client and Toolbox for each transport type.
STDIO Initialize
initialize (CLIENT, trace=t1, span=s1)                                   # FROM MCP Client
|
--- toolbox/server/mcp/stdio (SERVER, trace=t1, span=s2, parent=s1)      # IN TOOLBOX
    |
    --- initialize (SERVER, trace=t1, span=s3, parent=s2)                # IN TOOLBOX
STDIO Tool Call
tools/call get-weather (CLIENT, trace=t1, span=s1)                       # FROM MCP Client
|
--- toolbox/server/mcp/stdio (SERVER, trace=t1, span=s2, parent=s1)      # IN TOOLBOX
    |
    --- tools/call get-weather (SERVER, trace=t1, span=s3, parent=s2)    # IN TOOLBOX
SSE Connection
connection (CLIENT, trace=t1, span=s2, parent=s1)                        # FROM MCP Client
|
--- toolbox/server/mcp/sse (SERVER, trace=t1, span=s3, parent=s2)        # IN TOOLBOX
HTTP Initialize
initialize (CLIENT, trace=t1, span=s1)                                   # FROM MCP Client
|
--- toolbox/server/mcp/http (SERVER, trace=t1, span=s2, parent=s1)       # IN TOOLBOX
    |
    --- initialize (SERVER, trace=t1, span=s3, parent=s2)                # IN TOOLBOX
HTTP Tool Call
tools/call get-weather (CLIENT, trace=t1, span=s1)                       # FROM MCP Client
|
--- toolbox/server/mcp/http (SERVER, trace=t1, span=s2, parent=s1)       # IN TOOLBOX
    |
    --- tools/call get-weather (SERVER, trace=t1, span=s3, parent=s2)    # IN TOOLBOX
Resource Attributes
All metrics and traces generated within Toolbox will be associated with a unified resource. The list of resource attributes included are:
| Resource Name | Description |
|---|---|
| TelemetrySDK | TelemetrySDK version info. |
| OS | OS attributes including OS description and OS type. |
| Container | Container attributes including container ID, if applicable. |
| Host | Host attributes including host name. |
| SchemaURL | Sets the schema URL for the configured resource. |
service.name | Open telemetry service name. Defaulted to toolbox. User can set the service name via flag mentioned above to distinguish between different toolbox service. |
service.version | The version of Toolbox used. |
Exporter
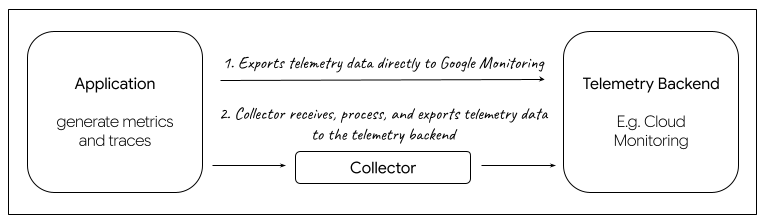
An exporter is responsible for processing and exporting telemetry data. Toolbox generates telemetry data within the OpenTelemetry Protocol (OTLP), and user can choose to use exporters that are designed to support the OpenTelemetry Protocol. Within Toolbox, we provide two types of exporter implementation to choose from, either the Google Cloud Exporter that will send data directly to the backend, or the OTLP Exporter along with a Collector that will act as a proxy to collect and export data to the telemetry backend of user’s choice.
Google Cloud Exporter
The Google Cloud Exporter directly exports telemetry to Google Cloud Monitoring. It utilizes the GCP Metric Exporter and GCP Trace Exporter.
Note
If you’re using Google Cloud Monitoring, the following APIs will need to be enabled:
OTLP Exporter
This implementation uses the default OTLP Exporter over HTTP for metrics and traces. You can use this exporter if you choose to export your telemetry data to a Collector.
Collector
A collector acts as a proxy between the application and the telemetry backend. It receives telemetry data, transforms it, and then exports data to backends that can store it permanently. Toolbox provide an option to export telemetry data to user’s choice of backend(s) that are compatible with the Open Telemetry Protocol (OTLP). If you would like to use a collector, please refer to this Export Telemetry using the Otel Collector.
Flags
The following flags are used to determine Toolbox’s telemetry configuration:
| flag | type | description |
|---|---|---|
--telemetry-gcp | bool | Enable exporting directly to Google Cloud Monitoring. Default is false. |
--telemetry-otlp | string | Enable exporting using OpenTelemetry Protocol (OTLP) to the specified endpoint (e.g. “127.0.0.1:4318”). To pass an insecure endpoint here, set environment variable OTEL_EXPORTER_OTLP_INSECURE=true. |
--telemetry-service-name | string | Sets the value of the service.name resource attribute. Default is toolbox. |
In addition to the flags noted above, you can also make additional configuration for OpenTelemetry via the General SDK Configuration through environmental variables.
Examples:
To enable Google Cloud Exporter:
./toolbox --telemetry-gcp
To enable OTLP Exporter, provide Collector endpoint:
./toolbox --telemetry-otlp="127.0.0.1:4553"